 Business · Management · Systems
Business Performance Reviews · Last updated: 13 October 2026
Can Lower Spend per Customer Mean Higher Profit?
Sometimes it can — if another change helps you handle the extra volume
In this article
AT A GLANCE
Cut a price by 3% on a product with a 30% contribution margin and contribution per unit falls by 10%. You need about 11% more sales volume just to maintain the same total contribution.
Yet Simbisa Kenya’s FY2026 results show average customer spending falling by 3% while customer volumes rose 14%, revenue increased 11% and operating profit grew 16%.
The figures do not establish what drove the improvement. For a price cut to pay, it needs sufficient genuinely additional volume, capacity to serve it and cash to fund it.
What Simbisa Kenya’s results show
Kenya faced pressure on household incomes and strong competition. Simbisa responded with value-focused offers, promotions and additional value meals, aiming to stimulate customer traffic and defend market share.
| Simbisa Kenya | Year-on-year change |
|---|---|
| Average customer spend (US$) | −3% |
| Customer volumes | +14% |
| Revenue | +11% |
| Operating profit | +16% |
| Delivery orders | +59% |
Source: Simbisa Brands FY2026 Audited Abridged Financial Results.
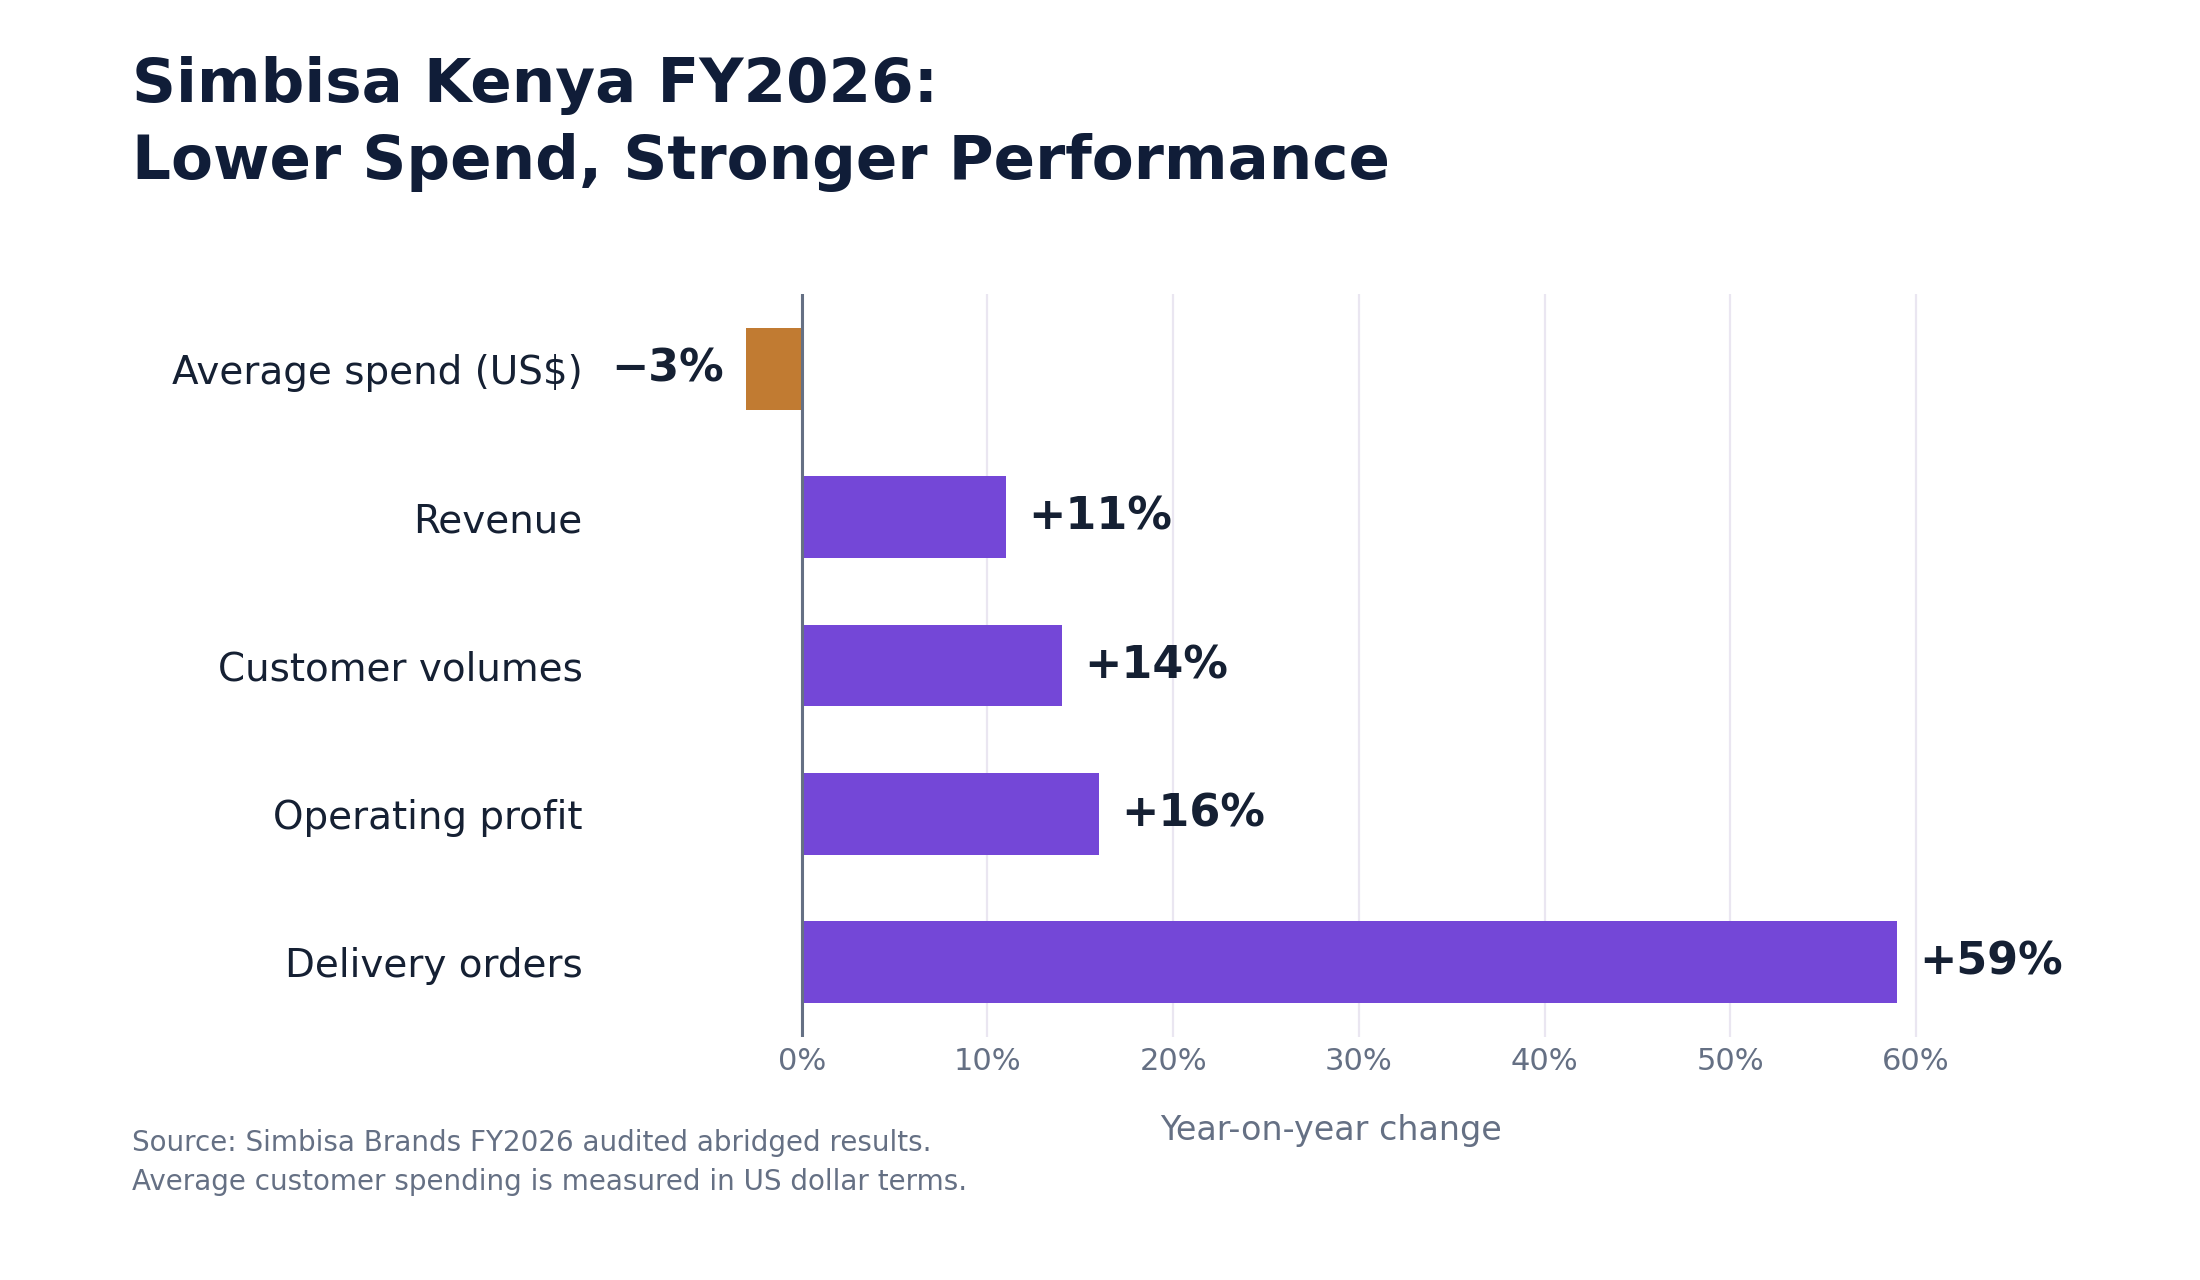
Figure 1. Simbisa Kenya FY2026: reported changes. Delivery orders are an operational measure.
The revenue figures are consistent: 14% more customer transactions at 3% lower average spending produces approximately 10.6% additional revenue, close to the reported 11% after rounding. Operating profit grew faster than revenue.
There is one qualification. Lower average spending does not establish that menu prices were reduced. Customers may have bought different products, chosen cheaper meals or responded to promotions. Simbisa also attributes its profit improvement to cost management and operating efficiencies. The disclosures establish the outcome but do not isolate the contribution of individual factors.
Simbisa added five net stores during FY2026, bringing its Kenyan network to 257. That represents roughly 2% network growth against a 14% increase in customer volumes. The figures suggest that existing outlets handled more business, although outlet-level data do not quantify that improvement.
The arithmetic of a price cut
Contribution is the amount remaining from each sale after variable production and selling costs. It covers fixed costs, with the balance becoming operating profit. Consider a product selling for KSh100, with variable costs of KSh70.
| Before price cut | After 3% cut | |
|---|---|---|
| Selling price | KSh100 | KSh97 |
| Variable cost | KSh70 | KSh70 |
| Contribution per unit | KSh30 | KSh27 |
| Minimum whole units to maintain KSh3,000 contribution | 100 | 112 |
- Selling price
- Before price cut
- KSh100
- After 3% cut
- KSh97
- Variable cost
- Before price cut
- KSh70
- After 3% cut
- KSh70
- Contribution per unit
- Before price cut
- KSh30
- After 3% cut
- KSh27
- Minimum whole units to maintain KSh3,000 contribution
- Before price cut
- 100
- After 3% cut
- 112
The 3% price reduction cuts contribution per unit from KSh30 to KSh27 — a 10% decline. To maintain KSh3,000 contribution, volume must rise by approximately 11.1%; 112 whole units are required.
Required volume increase (%) = [Price cut ÷ (Original contribution margin − Price cut)] × 100
Enter the price cut and margin as percentage-point numbers (for example, 3 and 30).
| Price reduction | 20% margin | 30% margin | 40% margin | 60% margin |
|---|---|---|---|---|
| 3% | 17.6% | 11.1% | 8.1% | 5.3% |
| 5% | 33.3% | 20.0% | 14.3% | 9.1% |
- Price reduction
- 3%
- 20% margin
- 17.6%
- 30% margin
- 11.1%
- 40% margin
- 8.1%
- 60% margin
- 5.3%
- Price reduction
- 5%
- 20% margin
- 33.3%
- 30% margin
- 20.0%
- 40% margin
- 14.3%
- 60% margin
- 9.1%
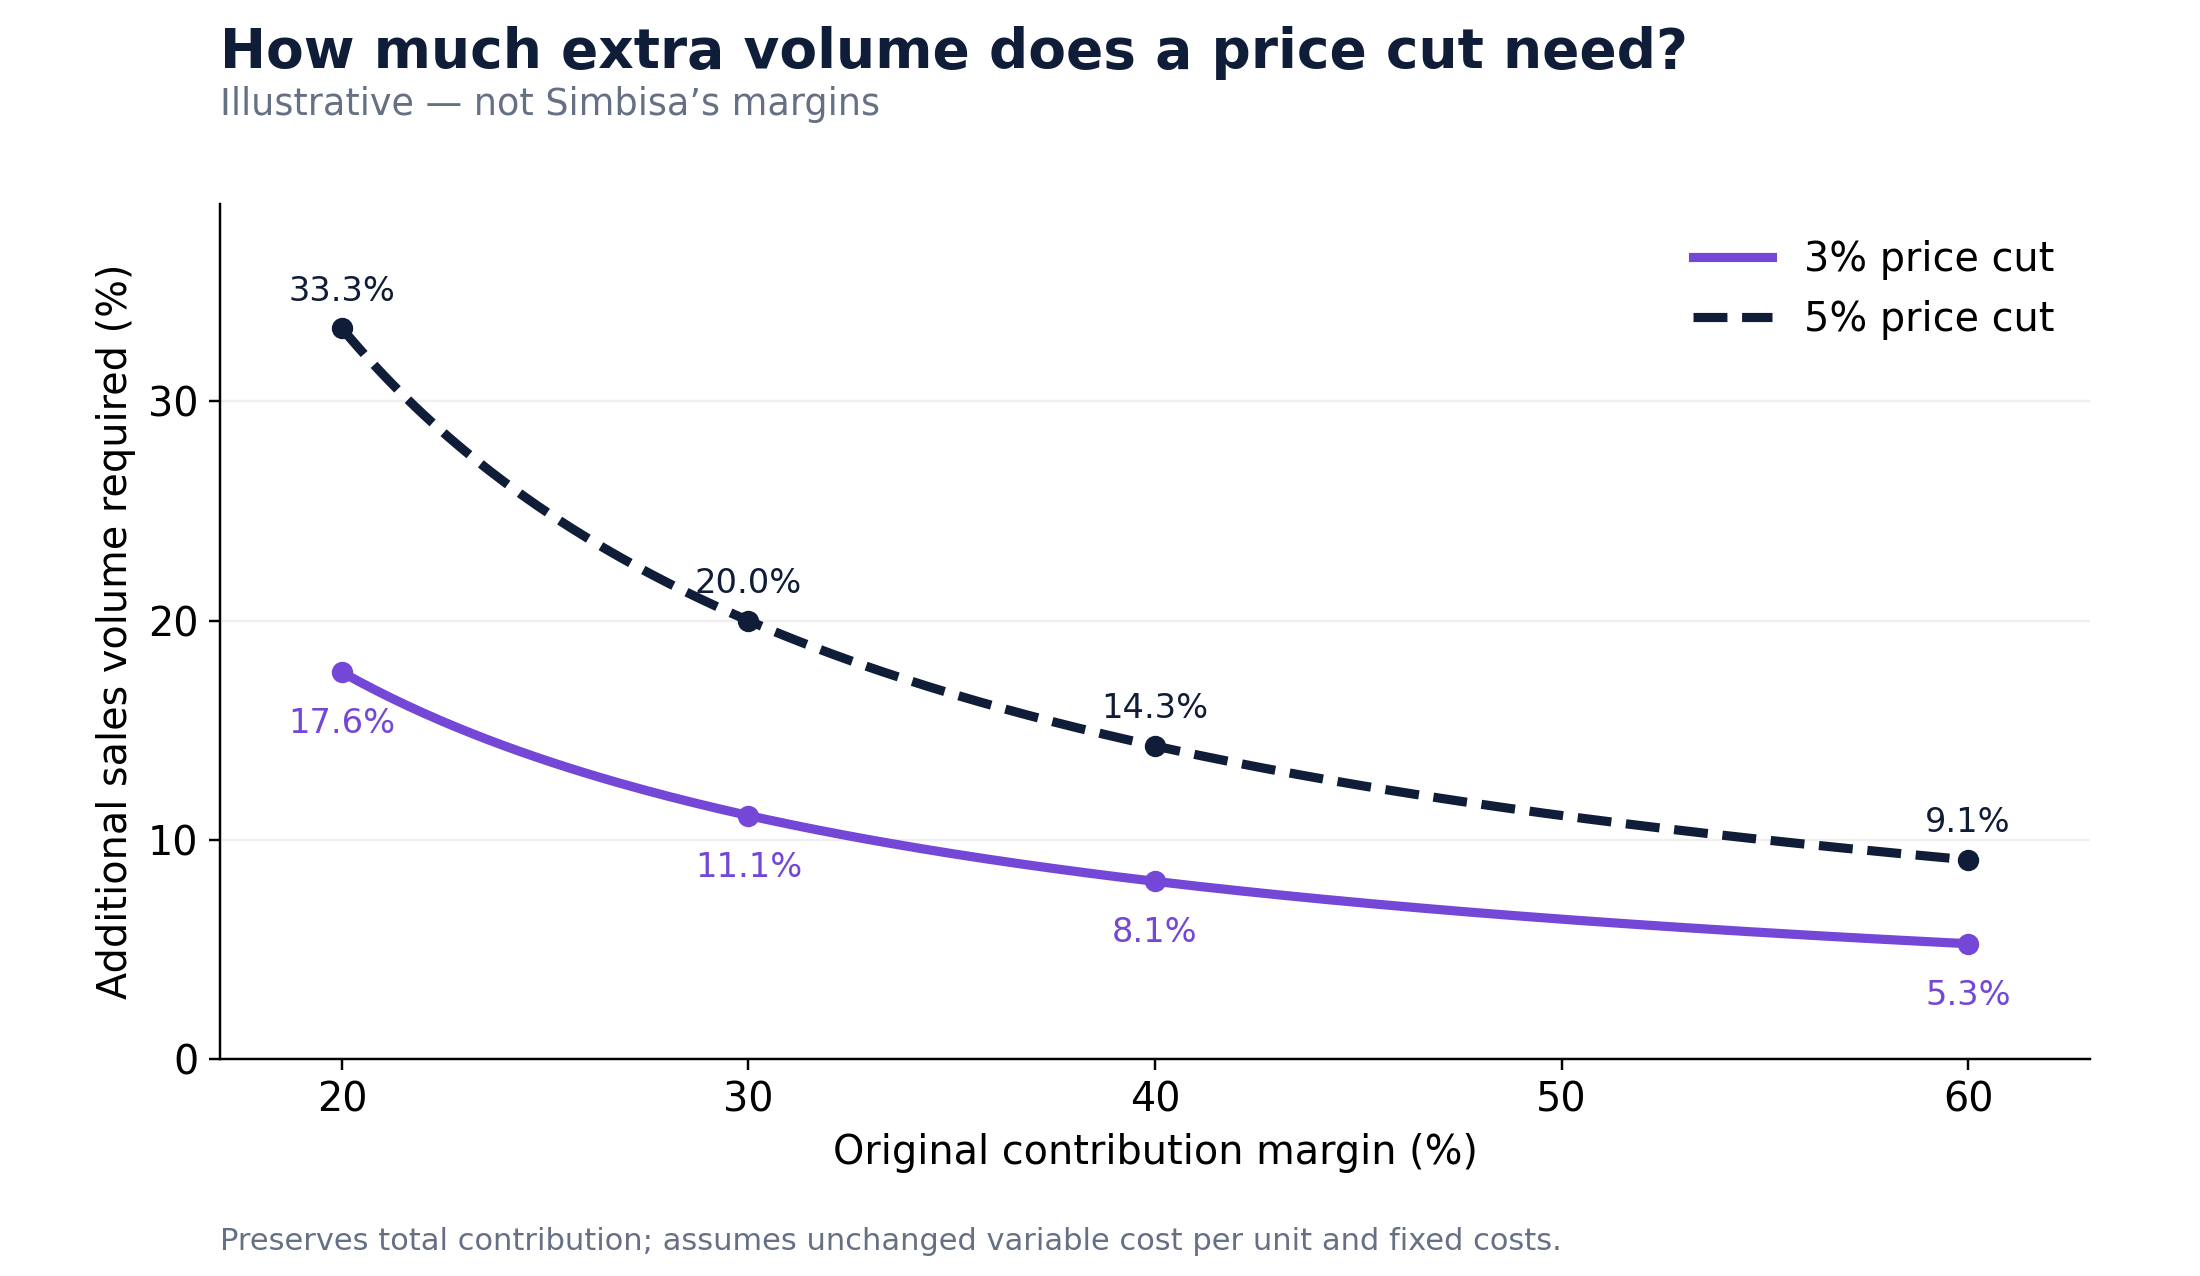
Illustrative calculations, not Simbisa’s margins. Variable cost per unit and fixed costs are assumed unchanged.
At a 20% margin, a 5% price reduction requires one-third more sales volume merely to maintain total contribution. At a 60% margin, it requires about 9%. Product-level contribution is therefore essential to pricing decisions.
Spare capacity changes the economics
Consider two manufacturers offering the same price reduction. One has unused machinery, available production hours and sufficient permanent staff. The other is near capacity and must introduce overtime, shifts or equipment. Their sales growth could be identical but their incremental profits very different.
Spare capacity makes extra volume more attractive when existing resources can absorb it. The benefit depends on incremental contribution exceeding extra costs. Manufacturers and distributors may also need more inventory and customer credit. Operating profit can rise while working capital absorbs cash.
Delivery as another route to customers
Simbisa Kenya’s delivery orders rose 59%, and delivery accounted for approximately 27% of turnover, according to its FY2026 analyst presentation. Delivery can create demand through existing kitchens without new outlets, but commissions, packaging, fulfilment and promotional costs affect contribution.
Simbisa reported growth through its own operations and third-party partnerships, without naming partners or disclosing separate delivery profitability. The principle extends to manufacturers and distributors using agents, resellers or marketplaces. The test is whether incremental contribution justifies the costs of reaching and serving those customers.
Price is only one lever
In Zimbabwe, FY2026 customer volumes and average spend each increased 11%; revenue rose 23% and operating profit 39%. Initiatives included better food quality, new products, improved service, targeted promotions, delivery growth of 75%, seventeen net new stores, six refurbishments and operating efficiencies.
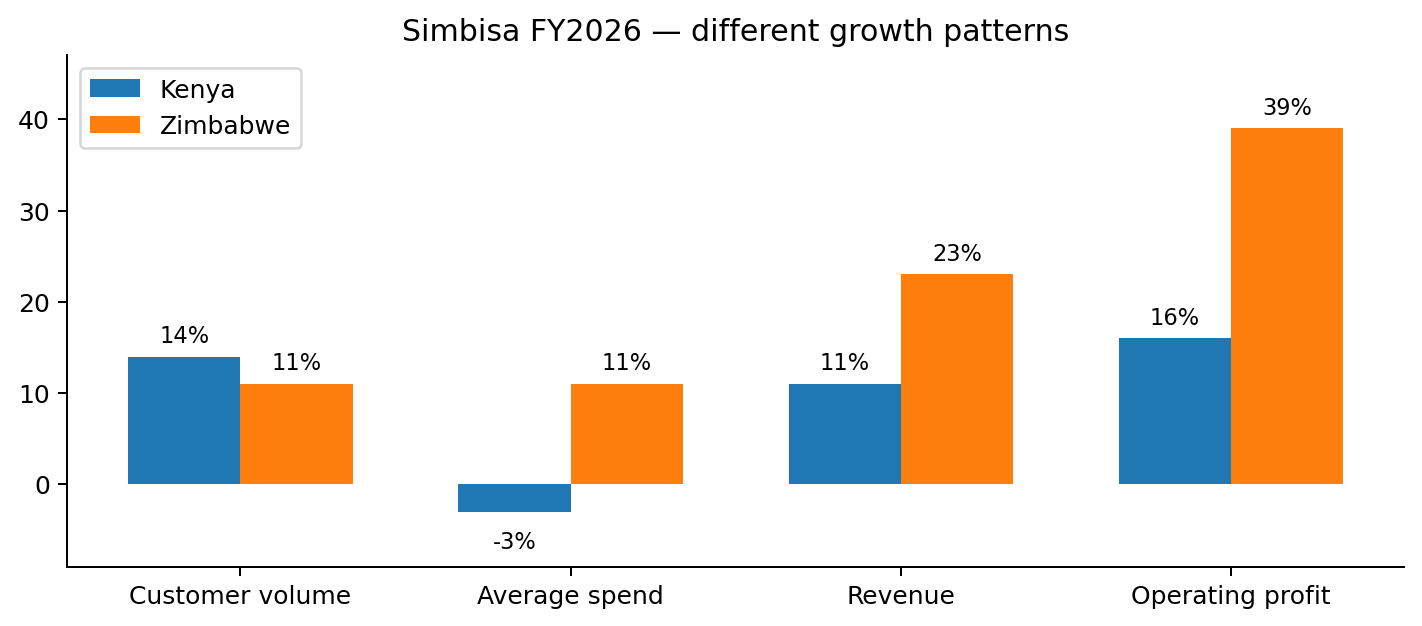
Figure 2. Kenya increased volumes despite lower average spend; Zimbabwe increased both.
Zimbabwe faced a Fast-Food Tax and intermittent power disruptions; Kenya faced income pressure and political unrest. The markets are not directly comparable. Both nevertheless achieved operating profit growth above revenue growth with different combinations of customer spending, volumes and efficiency.
Questions before changing prices
-
Volume: How much extra business is needed to preserve contribution and achieve the intended profit?
-
Capacity: Can existing facilities and staff handle the additional volume economically?
-
Demand: Are the additional sales genuinely new, or will existing customers simply pay less?
-
Cash: What extra inventory, credit and working capital will be required?
-
Alternatives: Could products, service, availability or distribution achieve more?
-
Market response: How might competitors react, and can the price reduction be reversed?
Where practical, trial a price change on a limited scale and measure contribution, incremental demand, capacity use and cash needs.
Can lower spend per customer mean higher profit? Yes, when the extra volume is genuine, capacity can absorb it and the additional working-capital requirement is manageable. Simbisa shows that it can happen without establishing which factors drove the result. Treat a price cut as an investment in demand: establish the return you need before you decide, and measure whether you get it.
Work with me
If sales are growing but margins are under pressure, I can help identify where profitability is being gained or lost. Through selected remote Business Performance Review assignments, I examine pricing, customer demand, contribution margins, capacity utilisation and distribution economics together.
Source Documents
-
Simbisa Brands — Audited Abridged Financial Results for the Year Ended 30 June 2026, published 29 September 2026.
-
Simbisa Brands — FY2026 Analyst Briefing Presentation, published 29 September 2026.
-
Simbisa Brands — Trading Update for the Third Quarter Ended 31 March 2026, published 15 May 2026.
Looking for an independent perspective on business performance, strategy or systems improvement?
© 2026 Murtaza Insights
More from Business Performance Reviews
Business Performance Reviews · Published: 11 November 2026
Your Sales Grew. But Did Your Business Actually Improve?
What Tesco, Sainsbury's and two Kenyan companies reveal about measuring genuine business improvement—and turning annual reviews into effective action plans.
Read ArticleMore Insights
Business Analysis & Strategy · Last updated: 13 November 2026
Should Your Budget Be Based on Your Ambitious Sales Target?
Keep ambitious sales targets without automatically committing the spending needed to achieve them.
Read Article
Business Analysis & Strategy · Last updated: 15 November 2026
Quickmart IPO: Valuation, Returns and Investment Risks
Quickmart is growing, profitable and attracting major investors. But at KSh7.50, does the potential return justify the risks? A closer look at the valuation, dividends, growth plans and IPO structure.
Read Article