 Business · Management · Systems
Business Performance Reviews · Published: 11 November 2026
Your Sales Grew. But Did Your Business Actually Improve?
What Tesco, Sainsbury's and two Kenyan companies reveal about measuring genuine business improvement—and turning annual reviews into effective action plans.
In this article
AT A GLANCE
Tesco and Sainsbury’s both increased sales, free cash flow and market share in 2025/26, yet their operating-profit trends differed, while both reported slightly lower returns on capital employed.
In Kenya, Kakuzi and Sasini both returned to profitability in 2025. Kakuzi generated KSh 853 million in operating cash flow, while Sasini absorbed KSh 708 million.
The differences matter to any business owner reviewing an apparently successful year. Higher sales and profits do not necessarily mean that capital is earning adequate returns, cash is being generated sustainably or the business has become stronger.
This article introduces a five-dimension Business Improvement Scorecard, applies it to the four companies and shows how the findings can shape three decisions for the next annual plan: what to fix, what to protect and where to invest.
ANALYSIS
What should an annual performance review measure?
Sales growth, profitability and cash flow are essential indicators. Their movements, however, need to be considered together.
A company may increase profit while investing more capital than the additional earnings justify. Cash flow may improve through better inventory management, or simply because maintenance and other necessary expenditure have been deferred.
The Business Improvement Scorecard examines five dimensions.
Table 1 — The Business Improvement Scorecard
| Dimension | What to assess | Evidence to examine |
|---|---|---|
| 1. Earnings quality | Are recurring operating earnings and margins improving? | Customer and product contribution, margins, exceptional and non-cash gains |
| 2. Capital productivity | Are assets and investments earning adequate returns? | Return on capital, asset utilisation, incremental investment returns and cost of capital |
| 3. Cash-generation quality | Are earnings converting into cash sustainably? | Working capital, receivables, inventory, supplier terms and investment commitments |
| 4. Competitive strength | Is the business winning and retaining profitable customers? | Market share, retention, pricing, customer profitability and service reliability |
| 5. Future capability and resilience | Can the business sustain and extend its performance? | Maintenance, people, systems, capacity and operating risks |
- Dimension
- 1. Earnings quality
- What to assess
- Are recurring operating earnings and margins improving?
- Evidence to examine
- Customer and product contribution, margins, exceptional and non-cash gains
- Dimension
- 2. Capital productivity
- What to assess
- Are assets and investments earning adequate returns?
- Evidence to examine
- Return on capital, asset utilisation, incremental investment returns and cost of capital
- Dimension
- 3. Cash-generation quality
- What to assess
- Are earnings converting into cash sustainably?
- Evidence to examine
- Working capital, receivables, inventory, supplier terms and investment commitments
- Dimension
- 4. Competitive strength
- What to assess
- Is the business winning and retaining profitable customers?
- Evidence to examine
- Market share, retention, pricing, customer profitability and service reliability
- Dimension
- 5. Future capability and resilience
- What to assess
- Can the business sustain and extend its performance?
- Evidence to examine
- Maintenance, people, systems, capacity and operating risks
A rating should reflect the direction of performance, the level reached and the factors responsible for the change. A modest decline in return on capital has different implications when earnings and asset utilisation are improving than when margins are falling and depreciation is increasing faster than operating earnings.
Tesco and Sainsbury’s: Similar sales growth, different profit outcomes
Both UK supermarket groups increased sales and gained market share during FY2025/26. Both also faced cost inflation, price competition and continuing pressure to invest in customer value.
Table 2 — UK supermarket performance
| Performance measure | Tesco | Sainsbury’s |
|---|---|---|
| Sales growth, excluding fuel | +4.6% | +4.3% |
| Sales growth, including fuel | +3.6% | +2.8% |
| Adjusted/underlying operating-profit growth | +0.8% | −1.1% |
| Operating margin, previous → current | 4.47% → 4.35% | 3.17% → 3.06% |
| Return on capital employed | 14.6% → 14.4% | 9.0% → 8.9% |
| Free cash flow | £1.75bn → £1.96bn | £531m → £574m |
- Performance measure
- Sales growth, excluding fuel
- Tesco
- +4.6%
- Sainsbury’s
- +4.3%
- Performance measure
- Sales growth, including fuel
- Tesco
- +3.6%
- Sainsbury’s
- +2.8%
- Performance measure
- Adjusted/underlying operating-profit growth
- Tesco
- +0.8%
- Sainsbury’s
- −1.1%
- Performance measure
- Operating margin, previous → current
- Tesco
- 4.47% → 4.35%
- Sainsbury’s
- 3.17% → 3.06%
- Performance measure
- Return on capital employed
- Tesco
- 14.6% → 14.4%
- Sainsbury’s
- 9.0% → 8.9%
- Performance measure
- Free cash flow
- Tesco
- £1.75bn → £1.96bn
- Sainsbury’s
- £531m → £574m
Sources: Published FY2025/26 results. Tesco’s measures principally relate to the group, while Sainsbury’s operating-profit and free-cash-flow measures relate to retail operations. Operating margins use revenue including fuel. Company definitions differ, so comparisons are principally within each company.
Tesco
Tesco increased adjusted operating profit, gained market share and generated more free cash flow. Its Save to Invest programme supported cost efficiency and helped fund continued investment in customer value.
Operating profit rose only 0.8%, however, against sales growth of 3.6% including fuel. Its calculated operating margin declined from 4.47% to 4.35%, while return on capital employed eased from 14.6% to 14.4%.
Tesco’s commercial execution was strong, but I would rate its earnings quality as mixed. Higher profit on substantially greater sales does not constitute improved margin performance, although the deterioration was modest.
The returns from continuing investment in distribution, technology and customer value will determine whether Tesco can translate its commercial progress into stronger capital productivity.
Sainsbury’s
Sainsbury’s grocery sales increased by 5.2%, supported by volume growth and market-share gains. The 4.3% growth shown in Table 2 covers total retail sales excluding fuel, including Argos and other non-grocery activities.
Underlying retail operating profit declined by 1.1%, despite substantial cost savings.
Retail underlying EBITDA increased by £19 million, but depreciation and amortisation rose by £30 million, leaving operating profit £11 million lower. EBITDA margin fell from 6.72% to 6.59%, while return on capital employed declined from 9.0% to 8.9%.
To me, this looks as much like a capital-returns problem as a pricing problem. Sainsbury’s has increased grocery volumes and strengthened its competitive position, but the additional business has yet to produce higher operating earnings on the capital committed.
Management’s investment in customer value may prove worthwhile over a longer period. The current results leave that case unproven.
Cash generation needs a separate assessment
Both companies increased free cash flow, but their cash-flow statements reveal a substantial contribution from working capital.
Tesco’s free cash flow increased by £207 million to £1,957 million. Its working-capital cash movement changed from a £45 million outflow in 2024/25 to a £385 million inflow in 2025/26, a favourable swing of £430 million. Cash generated from retail operations before working-capital changes increased by £92 million, but higher capital expenditure, tax payments and other outflows offset part of the working-capital benefit.
Tesco attributes the inflow partly to higher trade payables associated with sales growth, working-capital management and a payable relating to the new Extended Producer Responsibility levy. These factors need to be considered when assessing how much of the cash-flow improvement is repeatable.
Sainsbury’s retail free cash flow increased by £43 million. Cash generated before working-capital movements rose by £33 million, from £2,259 million to £2,292 million. Favourable working-capital movements increased from £98 million to £128 million, contributing an additional £30 million.
That £30 million is equivalent to approximately 70% of the increase in free cash flow. Other cash-flow changes also affected the final result, so the percentage is a measure of relative size rather than a complete attribution of the increase.
I would rate cash-generation quality as mixed for both companies. Each generated more free cash, but working-capital movements made a material contribution. Their sustainability matters as much as the reported increase.
My assessment
Tesco delivered the stronger overall operating performance in 2025/26. Its adjusted profit grew modestly, while Sainsbury’s underlying retail operating profit declined.
Both strengthened their competitive positions, although neither improved capital returns. Working capital flattered both cash-flow figures, and at Tesco the £430 million favourable swing was larger than the entire £207 million increase in free cash flow.
For manufacturers, retailers and distributors, the issue is familiar. Additional customers and sales volumes are valuable when the contribution earned justifies the pricing concessions, assets and working capital required to support them.
Kakuzi and Sasini: Profit recovery and capital returns
Both Kenyan agricultural companies reported a substantial recovery in profitability during 2025. Their results look different when biological-asset valuations, cash conversion and capital returns are examined.
Table 3 — Kenyan performance, 2025
| Measure | Kakuzi | Sasini |
|---|---|---|
| Reported pre-tax profit, KSh million | +568.4 | +344.0 |
| Indicative pre-tax result excluding identified biological-asset valuation movements, KSh million | +504.5 | −214.7 |
| Net operating cash flow, KSh million | +853.2 | −707.9 |
| Indicative ROCE — reported operating-profit basis | +7.4% | +1.6% |
| Indicative ROCE — after identified valuation adjustments | +6.5% | −0.6% |
- Measure
- Reported pre-tax profit, KSh million
- Kakuzi
- +568.4
- Sasini
- +344.0
- Measure
- Indicative pre-tax result excluding identified biological-asset valuation movements, KSh million
- Kakuzi
- +504.5
- Sasini
- −214.7
- Measure
- Net operating cash flow, KSh million
- Kakuzi
- +853.2
- Sasini
- −707.9
- Measure
- Indicative ROCE — reported operating-profit basis
- Kakuzi
- +7.4%
- Sasini
- +1.6%
- Measure
- Indicative ROCE — after identified valuation adjustments
- Kakuzi
- +6.5%
- Sasini
- −0.6%
Sources: Audited 2025 financial statements. The earnings adjustments and ROCE calculations are independent illustrative measures, not company-reported underlying results. Sasini’s profit and cash-flow figures relate to continuing operations. Calculations and limitations appear in Financial Annexure A.
Kakuzi
Kakuzi’s profit recovery remains substantial after adjusting for two identified biological-asset valuation movements. Its adjusted pre-tax result improved from a KSh 143.5 million loss in 2024 to a KSh 504.5 million profit in 2025.
Operating cash flow rose from approximately KSh 475 million to KSh 853 million, without a significant contribution from asset disposals or a release of working capital.
Its calculated operating return on capital also improved from negative 3.5% to positive 7.4%. Taken together, these figures provide convincing evidence of recovery.
There are qualifications to both earnings and cash generation. Operating cash included KSh 69.7 million of interest received, while cash tax payments were substantially below the year’s income-tax expense. Improved agricultural production and stronger macadamia prices also contributed to profitability.
The capital-return figure deserves scrutiny. Kakuzi’s 7.4% return represents considerable progress, but I would hesitate to call it satisfactory without examining the cost of capital and longer-term asset productivity.
Kakuzi has clearly improved. Whether it now earns an adequate return on the capital employed remains open, as discussed in the capital-returns comparison below.
Sasini
Sasini reported pre-tax profit of KSh 344 million, including KSh 558.8 million in biological-asset fair-value gains. Excluding the separately reported gain produces an indicative pre-tax loss of KSh 214.7 million.
The improvement from the comparable adjusted loss of approximately KSh 681 million in 2024 is substantial. Its remaining reported income and expenses moved in the right direction.
The cash-flow position is less encouraging. Inventories and trade and other receivables absorbed more than KSh 1 billion combined, while net operating cash flow from continuing operations fell from positive KSh 308.7 million in 2024 to negative KSh 707.9 million in 2025.
Sasini’s indicative ROCE improved from negative 3.3% to positive 1.6%. Excluding the identified biological-asset gain from operating profit produces a negative indicative return of approximately 0.6%.
The company’s capital base was materially affected by property revaluations and includes assets associated with discontinued operations. These limitations make the calculated returns less precise as measures of operating productivity.
I would regard Sasini’s results as progress in a recovery rather than a completed turnaround. Its capital-return position is considerably weaker than Kakuzi’s, even though both receive a mixed scorecard assessment. The improvement in adjusted earnings is meaningful, but the substantial cash absorption and weak capital returns remain concerns.
Assessing the adequacy of capital returns
The 7.4% and 1.6% calculated returns for Kakuzi and Sasini are both below the approximately 9.37% weighted-average accepted rate on Kenya’s 364-day Treasury bill issue dated 8 December 2025.
This is a rough late-2025 market reference. Kakuzi’s financial year ended in December, while Sasini’s ended in September, three months before the Treasury bill issue. Neither company’s operating return is directly comparable with a government security. Agricultural business risks, different asset bases and company-specific capital costs require separate consideration.
Kakuzi’s capital productivity recovered substantially, while Sasini’s remained weak. Neither return can be described as adequate solely because it improved from a loss.
THE SCORECARD APPLIED
What do the four companies’ results reveal?
Table 4 — Applied Business Improvement Scorecard
| Dimension | Tesco | Sainsbury’s | Kakuzi | Sasini |
|---|---|---|---|---|
| Earnings quality | Mixed | Deteriorated | Improved | Mixed |
| Capital productivity | Mixed | Deteriorated | Mixed | Mixed |
| Cash-generation quality | Mixed | Mixed | Improved | Deteriorated |
| Competitive strength | Improved | Improved | Not assessed | Not assessed |
| Future capability and resilience | Not assessed | Not assessed | Not assessed | Not assessed |
- Dimension
- Earnings quality
- Tesco
- Mixed
- Sainsbury’s
- Deteriorated
- Kakuzi
- Improved
- Sasini
- Mixed
- Dimension
- Capital productivity
- Tesco
- Mixed
- Sainsbury’s
- Deteriorated
- Kakuzi
- Mixed
- Sasini
- Mixed
- Dimension
- Cash-generation quality
- Tesco
- Mixed
- Sainsbury’s
- Mixed
- Kakuzi
- Improved
- Sasini
- Deteriorated
- Dimension
- Competitive strength
- Tesco
- Improved
- Sainsbury’s
- Improved
- Kakuzi
- Not assessed
- Sasini
- Not assessed
- Dimension
- Future capability and resilience
- Tesco
- Not assessed
- Sainsbury’s
- Not assessed
- Kakuzi
- Not assessed
- Sasini
- Not assessed
Independent assessments for the financial periods examined. “Mixed” indicates conflicting favourable and adverse evidence; “Not assessed” indicates insufficient public information for a reliable judgement. The ratings are not company-issued assessments.
Tesco: Sales, adjusted operating profit and free cash flow increased, but operating margin and ROCE declined slightly. A substantial favourable working-capital movement contributed to the free-cash-flow increase, supporting a mixed assessment of cash-generation quality despite the higher reported figure.
Sainsbury’s: Market share and free cash flow improved, but underlying retail operating profit, EBITDA margin and ROCE declined. Its cash-flow improvement also benefited materially from a larger working-capital inflow. These factors support deterioration in earnings quality and capital productivity, with a mixed assessment for cash-generation quality.
Kakuzi: Earnings and cash generation improved significantly. The recovery in calculated capital returns was substantial, although their adequacy has not been demonstrated. Its capital-productivity rating remains mixed for that reason.
Sasini: Adjusted earnings improved but remained negative. Capital returns recovered from a loss-making position yet remained weak, considerably below Kakuzi’s calculated return, while operating cash flow deteriorated sharply. The mixed earnings and capital assessments recognise progress alongside the remaining weaknesses.
Why there is no overall numerical rating
Adding the five ratings into a composite score would require assigning weights to measures that may be closely related.
A reduction in inventory, for example, may improve cash flow while causing stock shortages and lost customers. Deferred maintenance may temporarily improve profits but increase equipment failures later.
The review needs to examine the decisions producing these effects and their overall economic consequences.
Published accounts also provide limited evidence of operational resilience. The four-company assessment cannot reliably determine whether maintenance, employee capability, technology systems or production reliability improved. Those matters require internal operating information.
For each material finding, I would record what changed, the underlying cause, whether the movement is sustainable and the decision that follows.
FROM FINDINGS TO ACTION
The scorecard becomes useful when its findings influence the decisions made by management.
Table 5 — Findings and management responses
| Performance finding | Management response | Evidence to monitor |
|---|---|---|
| Sales rising, contribution margins falling | Review pricing, discounts and customer profitability | Contribution by customer and product |
| Profits rising, capital returns declining | Examine recent investments and underutilised assets | Incremental returns and utilisation |
| Profits improving, cash conversion weakening | Investigate inventories, credit terms and collections | Receivable ageing, stock quality and cash conversion |
| Market share increasing, profitability declining | Test the economics of customer acquisition and retention | Customer contribution and repeat purchasing |
| Current profits improving, operational reliability weakening | Review maintenance, employee capability and operating systems | Downtime, service failures and maintenance backlog |
- Performance finding
- Sales rising, contribution margins falling
- Management response
- Review pricing, discounts and customer profitability
- Evidence to monitor
- Contribution by customer and product
- Performance finding
- Profits rising, capital returns declining
- Management response
- Examine recent investments and underutilised assets
- Evidence to monitor
- Incremental returns and utilisation
- Performance finding
- Profits improving, cash conversion weakening
- Management response
- Investigate inventories, credit terms and collections
- Evidence to monitor
- Receivable ageing, stock quality and cash conversion
- Performance finding
- Market share increasing, profitability declining
- Management response
- Test the economics of customer acquisition and retention
- Evidence to monitor
- Customer contribution and repeat purchasing
- Performance finding
- Current profits improving, operational reliability weakening
- Management response
- Review maintenance, employee capability and operating systems
- Evidence to monitor
- Downtime, service failures and maintenance backlog
An adverse indicator does not always warrant immediate corrective action. Higher inventories may support profitable seasonal demand, while lower current returns may follow investment in capacity that has yet to reach efficient utilisation.
A distributor’s credit policy
Consider a distributor that extends credit to larger customers. Sales and operating profit increase, but receivables grow faster than revenue and additional borrowing becomes necessary.
The first response might be to tighten credit or accelerate collections. I would start by examining the economics of those customers: their contribution after delivery costs, financing costs, collection risks and other resources required to service them.
If the incremental return justifies the additional capital, the credit policy may be commercially sound. Otherwise, management can renegotiate terms, revise prices, reduce exposure to low-return customers or redirect resources towards more profitable accounts.
The choice depends on the incremental economics of the business being won.
THREE DECISIONS BEFORE THE NEXT ANNUAL PLAN
The annual performance review should conclude with a limited number of priorities that management is prepared to implement.
What must we fix?
Identify the weakness most likely to damage sustainable returns. It may involve customer profitability, excessive working capital, poor asset utilisation or unreliable operations. Examine the cause and agree on corrective action.
What must we protect?
Identify the capabilities and competitive advantages supporting performance. These may include customer relationships, product quality, distribution reliability, experienced employees and effective information systems. Protect them when considering cost reductions or operational changes.
Where should we invest?
Choose opportunities with credible prospects for improving future returns. Assess the expected benefits, capital requirements, implementation risks and milestones before committing resources.
Each priority should have an accountable executive, a defined action, a measurable outcome, agreed resources and a review date. Targets should reflect the business’s circumstances and economics rather than arbitrary percentages.
An initial review after approximately 90 days can assess progress against implementation milestones and the assumptions behind the decisions. Investments requiring longer periods should be monitored through an appropriate sequence of reviews.
CONCLUSION
Tesco and Sainsbury’s show how similar commercial progress can produce different operating-profit and capital-return outcomes. Kakuzi and Sasini demonstrate how biological-asset valuations, working-capital movements and the capital employed can change the interpretation of a reported profit recovery.
The five-dimension scorecard provides a basis for examining these measures together, while identifying where the accounts leave important questions unanswered.
An annual review should give management a clear understanding of the business’s strengths, weaknesses and capacity to earn sustainable returns. Its findings should determine where attention, resources and capital are directed next.
Before approving the next annual plan, every owner and CEO should be able to answer:
What are the three most important decisions we will make differently because of what we learned from this year’s performance?
If the review cannot answer that question, it remains unfinished.
METHODOLOGY & DISCLOSURE
The analysis uses published company results and audited financial statements. Tesco and Sainsbury’s apply different reporting definitions for certain performance measures. Kakuzi and Sasini differ in financial year-ends, agricultural activities, asset bases and accounting treatments.
The Kenyan earnings adjustments and ROCE calculations are independent illustrative analyses, not company-reported measures of underlying performance. Excluding selected biological-asset fair-value movements does not eliminate every valuation effect or establish sustainable earnings. These movements may reflect genuine economic changes.
The December 2025 Kenyan Treasury bill rate provides historical market context only. It is not a company-specific cost-of-capital calculation and is not contemporaneous with Sasini’s September year-end.
The assessments concern the financial periods examined and are subject to the limitations of publicly available information.
This article is independent business commentary, not a recommendation to buy or sell securities.
FINANCIAL ANNEXURE A — DETAILED ANALYSIS & RECONCILIATIONS
The following calculations support the comparisons and scorecard assessments.
A1. Tesco — FY2025/26 comparable 52-week basis
| £ million, unless stated | FY2024/25 | FY2025/26 |
|---|---|---|
| Sales excluding fuel | 63,636 | 66,588 |
| Revenue including fuel | 69,916 | 72,464 |
| Adjusted operating profit | 3,128 | 3,152 |
| Calculated adjusted operating margin | 4.47% | 4.35% |
| Retail cash generated before working-capital movements | 4,692 | 4,784 |
| Retail working-capital cash movement | −45 | +385 |
| Retail cash generated from operations before adjusting items | 4,647 | 5,169 |
| Free cash flow | 1,750 | 1,957 |
| Return on capital employed | 14.6% | 14.4% |
- £ million, unless stated
- Sales excluding fuel
- FY2024/25
- 63,636
- FY2025/26
- 66,588
- £ million, unless stated
- Revenue including fuel
- FY2024/25
- 69,916
- FY2025/26
- 72,464
- £ million, unless stated
- Adjusted operating profit
- FY2024/25
- 3,128
- FY2025/26
- 3,152
- £ million, unless stated
- Calculated adjusted operating margin
- FY2024/25
- 4.47%
- FY2025/26
- 4.35%
- £ million, unless stated
- Retail cash generated before working-capital movements
- FY2024/25
- 4,692
- FY2025/26
- 4,784
- £ million, unless stated
- Retail working-capital cash movement
- FY2024/25
- −45
- FY2025/26
- +385
- £ million, unless stated
- Retail cash generated from operations before adjusting items
- FY2024/25
- 4,647
- FY2025/26
- 5,169
- £ million, unless stated
- Free cash flow
- FY2024/25
- 1,750
- FY2025/26
- 1,957
- £ million, unless stated
- Return on capital employed
- FY2024/25
- 14.6%
- FY2025/26
- 14.4%
Tesco’s statutory FY2025/26 period comprised 53 weeks. The figures above use its comparable 52-week measures. Both operating-margin calculations use adjusted operating profit and revenue on that basis.
The £430 million favourable movement in retail working capital was greater than the £207 million increase in free cash flow. Higher capital expenditure, tax payments and other cash outflows offset part of the improvement. Working-capital inflows reflected higher trade payables, disciplined management of working capital and a payable associated with the new Extended Producer Responsibility levy.
The company reports its operating margins rounded to one decimal place.
A2. Sainsbury’s — FY2025/26
| £ million, unless stated | FY2024/25 | FY2025/26 |
|---|---|---|
| Retail sales excluding fuel | 28,754 | 29,992 |
| Retail sales including fuel | 32,630 | 33,551 |
| Retail underlying operating profit | 1,036 | 1,025 |
| Retail underlying EBITDA | 2,192 | 2,211 |
| Underlying depreciation and amortisation | 1,156 | 1,186 |
| Retail underlying operating margin | 3.17% | 3.06% |
| Retail underlying EBITDA margin | 6.72% | 6.59% |
| Retail operating cash flow before working-capital changes | 2,259 | 2,292 |
| Favourable working-capital cash movement | +98 | +128 |
| Retail free cash flow | 531 | 574 |
| Return on capital employed | 9.0% | 8.9% |
- £ million, unless stated
- Retail sales excluding fuel
- FY2024/25
- 28,754
- FY2025/26
- 29,992
- £ million, unless stated
- Retail sales including fuel
- FY2024/25
- 32,630
- FY2025/26
- 33,551
- £ million, unless stated
- Retail underlying operating profit
- FY2024/25
- 1,036
- FY2025/26
- 1,025
- £ million, unless stated
- Retail underlying EBITDA
- FY2024/25
- 2,192
- FY2025/26
- 2,211
- £ million, unless stated
- Underlying depreciation and amortisation
- FY2024/25
- 1,156
- FY2025/26
- 1,186
- £ million, unless stated
- Retail underlying operating margin
- FY2024/25
- 3.17%
- FY2025/26
- 3.06%
- £ million, unless stated
- Retail underlying EBITDA margin
- FY2024/25
- 6.72%
- FY2025/26
- 6.59%
- £ million, unless stated
- Retail operating cash flow before working-capital changes
- FY2024/25
- 2,259
- FY2025/26
- 2,292
- £ million, unless stated
- Favourable working-capital cash movement
- FY2024/25
- +98
- FY2025/26
- +128
- £ million, unless stated
- Retail free cash flow
- FY2024/25
- 531
- FY2025/26
- 574
- £ million, unless stated
- Return on capital employed
- FY2024/25
- 9.0%
- FY2025/26
- 8.9%
Sales figures exclude VAT. Operating and EBITDA margins use retail sales including fuel.
EBITDA increased by £19 million, while depreciation and amortisation increased by £30 million, leaving an £11 million decrease in underlying retail operating profit.
The favourable working-capital movement increased by £30 million. This equals approximately 70% of the £43 million year-on-year increase in free cash flow, although other cash-flow movements also affect the final total.
A3. Kakuzi — Earnings adjustments
| KSh million | 2024 | 2025 |
|---|---|---|
| Reported pre-tax profit/(loss) | −166.7 | +568.4 |
| Fair-value gain on non-current biological assets | +238.0 | +98.2 |
| Fair-value movement on growing agricultural produce | −261.2 | −34.3 |
| Net identified valuation movement | −23.3 | +64.0 |
| Indicative pre-tax result excluding both movements | −143.5 | +504.5 |
- KSh million
- Reported pre-tax profit/(loss)
- 2024
- −166.7
- 2025
- +568.4
- KSh million
- Fair-value gain on non-current biological assets
- 2024
- +238.0
- 2025
- +98.2
- KSh million
- Fair-value movement on growing agricultural produce
- 2024
- −261.2
- 2025
- −34.3
- KSh million
- Net identified valuation movement
- 2024
- −23.3
- 2025
- +64.0
- KSh million
- Indicative pre-tax result excluding both movements
- 2024
- −143.5
- 2025
- +504.5
Calculated using unrounded audited figures. Totals may differ slightly due to rounding.
The two identified biological-asset valuation movements contributed approximately KSh 87 million to the reported pre-tax improvement of approximately KSh 735 million.
Operating cash-flow reconciliation — 2025
| Component | KSh million |
|---|---|
| Profit before tax | 568.4 |
| Net non-cash adjustments | +267.6 |
| Working-capital movements | −18.6 |
| Cash generated from operations | 817.4 |
| Interest received | +69.7 |
| Income tax paid | −34.0 |
| Net operating cash flow | 853.2 |
Figures rounded; totals may not sum exactly.
Working capital absorbed cash. Proceeds from disposals of property, plant and equipment were less than KSh 0.5 million. Interest received was included in operating cash flow, and cash tax payments were below the reported tax expense of approximately KSh 180.8 million.
A4. Sasini — Earnings adjustments
| Continuing operations, KSh million | 2024 | 2025 |
|---|---|---|
| Reported pre-tax profit/(loss) | −666.17 | +344.03 |
| Separately reported biological-asset fair-value gains | +15.01 | +558.76 |
| Indicative result excluding those gains | −681.18 | −214.73 |
- Continuing operations, KSh million
- Reported pre-tax profit/(loss)
- 2024
- −666.17
- 2025
- +344.03
- Continuing operations, KSh million
- Separately reported biological-asset fair-value gains
- 2024
- +15.01
- 2025
- +558.76
- Continuing operations, KSh million
- Indicative result excluding those gains
- 2024
- −681.18
- 2025
- −214.73
Calculated from audited KSh ’000 figures using re-presented comparatives. This is not a company-reported underlying-profit measure.
Operating cash-flow reconciliation — 2025
| Continuing operations, KSh million | Amount |
|---|---|
| Operating cash before working-capital movements | +490.5 |
| Increase in inventories | −305.5 |
| Increase in trade and other receivables | −737.5 |
| Increase in trade and other payables | +99.6 |
| Cash used in operations | −452.8 |
| Gratuity paid | −62.4 |
| Interest paid on lease liabilities | −5.1 |
| Income tax paid | −187.6 |
| Net operating cash flow | −707.9 |
Figures rounded; totals may not sum exactly.
The 2025 annual report shows comparable net operating cash flow from continuing operations of positive KSh 308.694 million in 2024.
Sasini also reported KSh 115.8 million of interest paid on other borrowings under financing activities, outside the operating cash-flow figure.
A5. Kenyan companies — Return on capital
The calculation uses:
ROCE = Operating profit ÷ Average capital employed × 100
Capital employed is defined as consolidated total assets less current liabilities. Opening and closing year-end balances are averaged.
Capital employed at each year-end
| KSh million | 2023 | 2024 | 2025 |
|---|---|---|---|
| Kakuzi | 7,233.295 | 6,601.274 | 6,824.768 |
| Sasini | 15,879.428 | 24,656.290 | 24,869.208 |
- KSh million
- Kakuzi
- 2023
- 7,233.295
- 2024
- 6,601.274
- 2025
- 6,824.768
- KSh million
- Sasini
- 2023
- 15,879.428
- 2024
- 24,656.290
- 2025
- 24,869.208
Sources: Kakuzi audited balance sheets and Sasini’s five-year comparative financial statements. Sasini’s figures reconcile with consolidated equity and non-current liabilities.
Calculated ROCE
| KSh million, except percentages | Kakuzi 2024 | Kakuzi 2025 | Sasini 2024 | Sasini 2025 |
|---|---|---|---|---|
| Operating profit/(loss) | −238.9 | +498.8 | −672.5 | +407.6 |
| Average capital employed | 6,917.3 | 6,713.0 | 20,267.9 | 24,762.7 |
| Indicative ROCE | −3.5% | +7.4% | −3.3% | +1.6% |
- KSh million, except percentages
- Operating profit/(loss)
- Kakuzi 2024
- −238.9
- Kakuzi 2025
- +498.8
- Sasini 2024
- −672.5
- Sasini 2025
- +407.6
- KSh million, except percentages
- Average capital employed
- Kakuzi 2024
- 6,917.3
- Kakuzi 2025
- 6,713.0
- Sasini 2024
- 20,267.9
- Sasini 2025
- 24,762.7
- KSh million, except percentages
- Indicative ROCE
- Kakuzi 2024
- −3.5%
- Kakuzi 2025
- +7.4%
- Sasini 2024
- −3.3%
- Sasini 2025
- +1.6%
2025 after identified biological-asset valuation adjustments
| Measure | Kakuzi | Sasini |
|---|---|---|
| Adjusted operating profit/(loss), KSh million | +434.8 | −151.1 |
| Average capital employed, KSh million | 6,713.0 | 24,762.7 |
| Indicative adjusted ROCE | +6.5% | −0.6% |
- Measure
- Adjusted operating profit/(loss), KSh million
- Kakuzi
- +434.8
- Sasini
- −151.1
- Measure
- Average capital employed, KSh million
- Kakuzi
- 6,713.0
- Sasini
- 24,762.7
- Measure
- Indicative adjusted ROCE
- Kakuzi
- +6.5%
- Sasini
- −0.6%
The identified biological-asset valuation adjustments affect the operating-profit numerator only. Capital-employed balances remain unadjusted.
Sasini’s adjusted operating loss is calculated directly from the audited figures: KSh 407.616 million operating profit less KSh 558.759 million of biological-asset fair-value gains equals negative KSh 151.143 million.
Limitations
Kakuzi’s capital base includes substantial cash balances and biological assets subject to valuation estimates.
Sasini recorded a KSh 8.136 billion revaluation of assets, net of tax, in 2024. This contributed materially to the increase in capital employed between 2023 and 2024 and complicates comparisons of capital productivity across those years.
Its consolidated assets also include assets associated with discontinued operations, while the operating-profit numerator relates to continuing operations. The calculation therefore does not fully align the capital employed with the related operating earnings.
Neither company’s return can be judged adequate without examining its cost of capital and operating risks. These calculations also differ in definition from the UK supermarkets’ published ROCE measures.
A6. Kenyan interest-rate context
The Central Bank of Kenya’s Treasury bill auction results announced on 4 December 2025, for issues dated 8 December 2025, reported:
| Instrument | Weighted-average accepted interest rate |
|---|---|
| 91-day Treasury bill | 7.7798% |
| 182-day Treasury bill | 7.8043% |
| 364-day Treasury bill | 9.3681% |
The 364-day rate offers a broad late-2025 market reference. It is not a risk-adjusted benchmark for agricultural businesses or a substitute for estimating their cost of capital. Sasini’s financial year ended on 30 September 2025.
SOURCES & REFERENCES
1. Tesco PLC — Preliminary Results 2025/26, 16 April 2026
Detailed preliminary-results statement
2. J Sainsbury PLC — Preliminary Results and Annual Report 2026
Detailed preliminary-results presentation
3. Kakuzi PLC — Annual Reports and Audited Financial Statements
4. Sasini PLC — Annual Reports and Audited Financial Statements
5. Central Bank of Kenya — Treasury Bill Results, Issues Dated 8 December 2025
What Would an Independent Review Reveal About Your Business?
Your annual performance review should identify what has improved, where weaknesses remain and which management decisions require attention. That requires examining the reasons behind financial results and their implications for future performance.
Drawing on more than 35 years of senior executive experience, I undertake selected remote advisory assignments through Murtaza Insights, covering Business Performance Reviews, Business Analysis & Strategy, and Information Systems & Process Improvement.
The focus is on independent assessment, practical judgement and clear management priorities.
© 2026 Murtaza Insights
More from Business Performance Reviews
Business Performance Reviews · Last updated: 13 October 2026
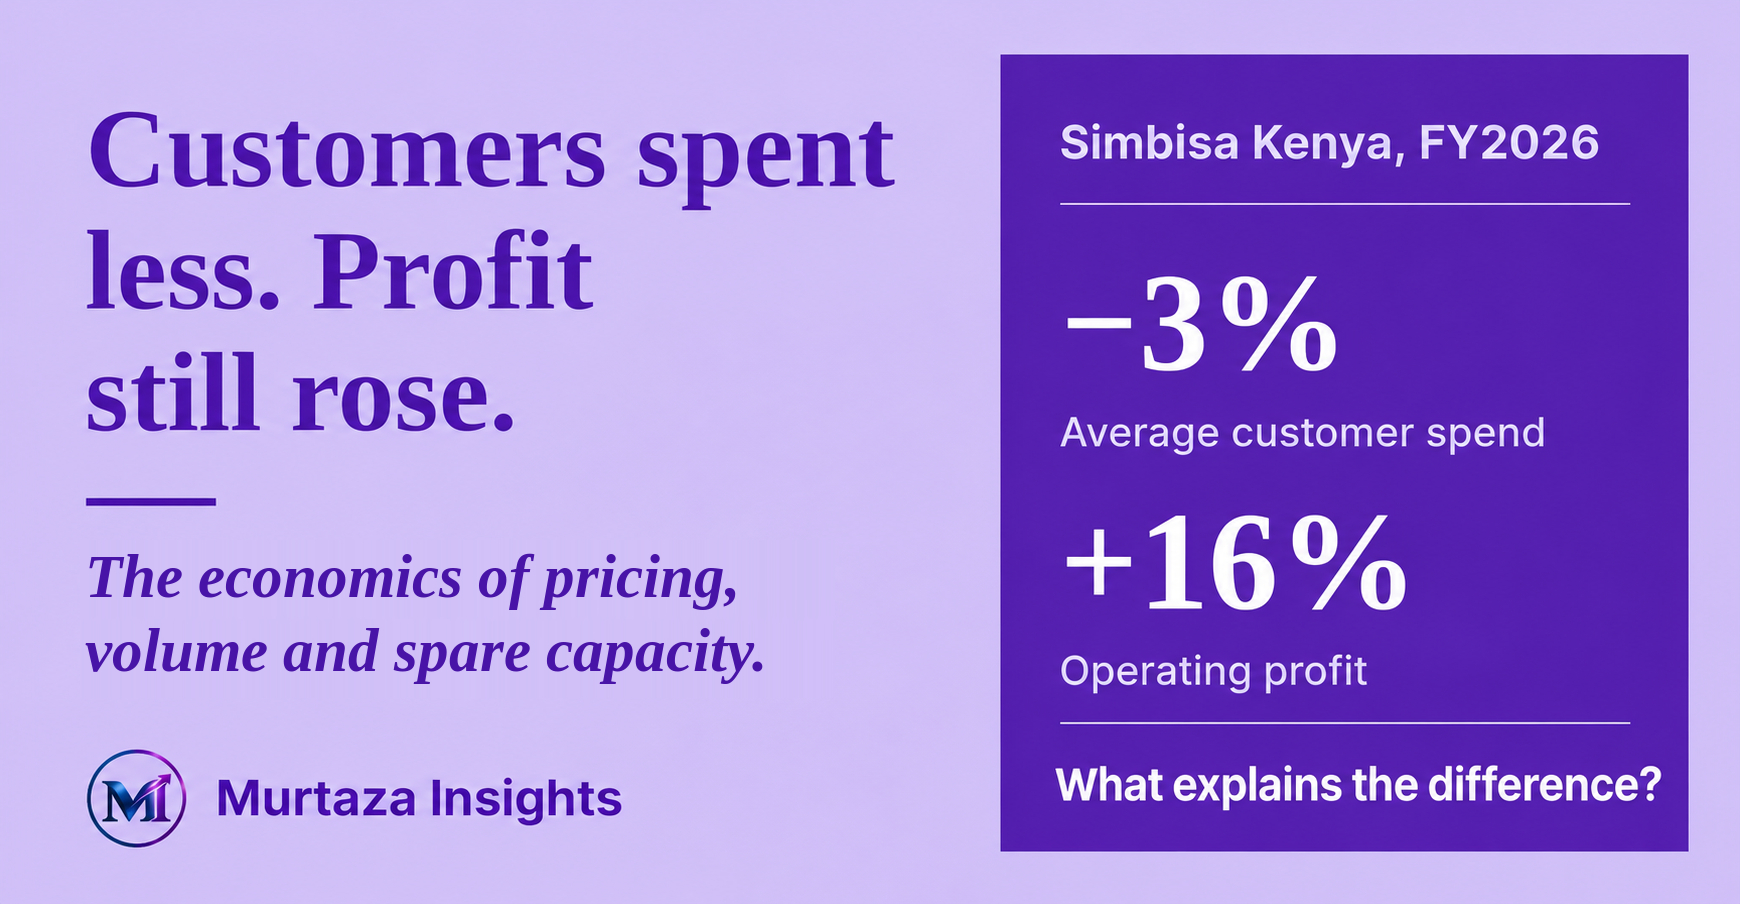
Can Lower Spend per Customer Mean Higher Profit?
Explore how lower prices can improve business performance when a second change helps you reach and serve more customers economically, using Simbisa as an example.
Read ArticleMore Insights
Business Analysis & Strategy · Last updated: 13 November 2026
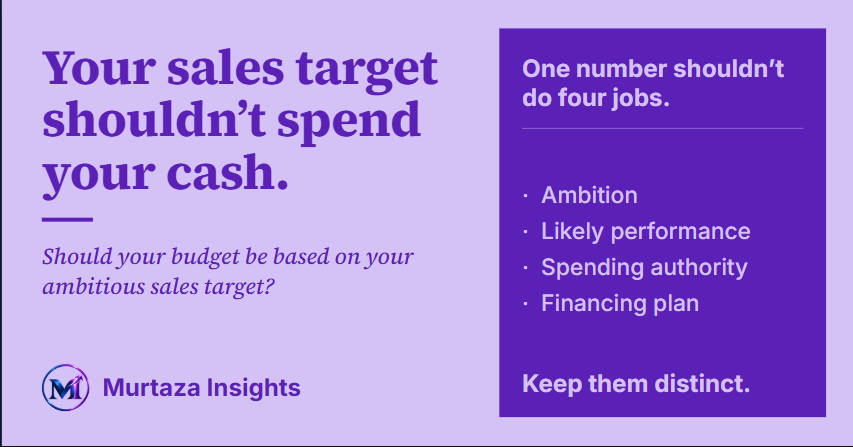
Should Your Budget Be Based on Your Ambitious Sales Target?
Keep ambitious sales targets without automatically committing the spending needed to achieve them.
Read Article
Business Analysis & Strategy · Last updated: 15 November 2026
Quickmart IPO: Valuation, Returns and Investment Risks
Quickmart is growing, profitable and attracting major investors. But at KSh7.50, does the potential return justify the risks? A closer look at the valuation, dividends, growth plans and IPO structure.
Read Article